
How a utility turned 1,200 scattered systems into a blueprint for 25 data products
Every new AI or analytics project started from scratch across roughly 1,200 systems. Agile Brains helped a utility define 25 reusable data products, map the sources behind them, and sequence the roadmap to build them.

A large East Coast electric and gas utility wanted to deliver AI and analytics at scale, but every use case meant wrangling data from scratch across a sprawl of source systems. Working alongside the utility's enterprise data and analytics team, we helped define the reusable data products the whole enterprise could stand on, and the roadmap to build them.
The challenge
The utility's data lived in roughly 1,200 applications, stitched together by point-to-point integrations built one at a time. Every new analytics or AI initiative started over: hunting down the right systems, extracting and reconciling data by hand, and rebuilding plumbing someone had probably built before.
As the company moved into its next rate period with three big priorities riding on data (the clean-energy transition, climate resilience and world-class reliability), that model couldn't scale. What it needed wasn't more access to systems but a shared set of curated, governed sources of truth. And no one had a comprehensive, agreed map of which data products the enterprise actually needed, or where the data behind them lived.
How we helped
We built a catalog of data products designed to be MECE, mutually exclusive and collectively exhaustive, so the set covers the enterprise's data without gaps or overlaps. We validated it where the data actually lives, through structured data-contextualization sessions with business units across electric and gas operations, customer, construction, supply chain, finance and strategic planning. In parallel, we ran the analysis to back it up.
The demand side. We cataloged more than 500 data components from those sessions, cleaned and de-duplicated them, and grouped them into about 40 functional themes.
The supply side. We filtered the estate of roughly 1,200 applications down to the several hundred business-critical operational systems, then to about 40 priority source systems.
The connective tissue. A source-to-product mapping ties each source system to its functional themes and to the data products it feeds. A source's value is defined by how many data products it supports, so the build order follows real reuse.
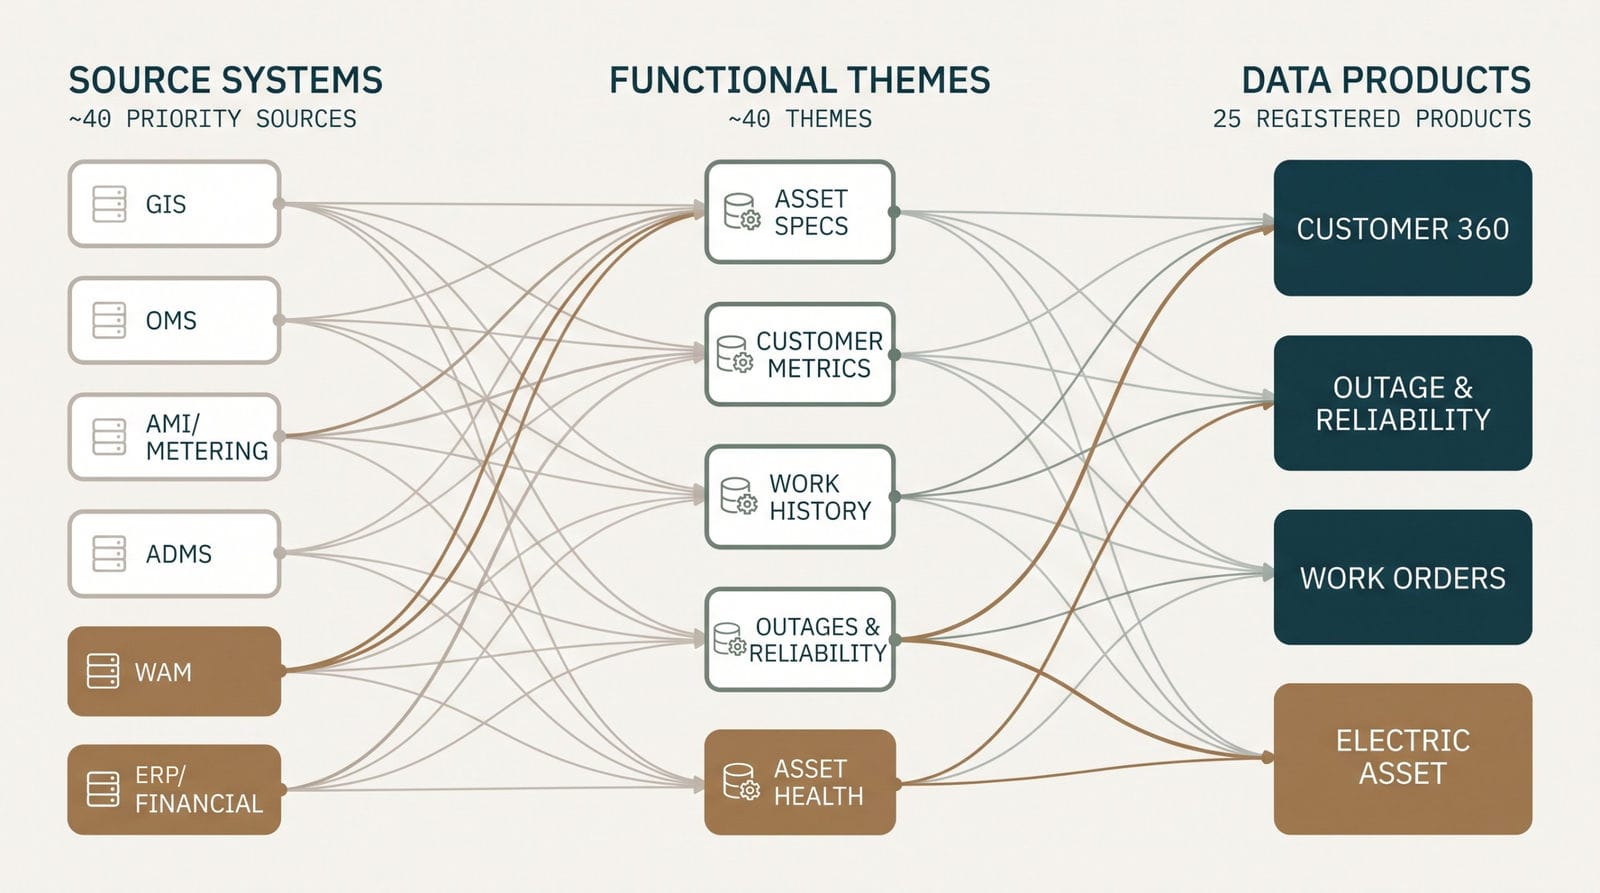
What the utility now has. A catalog of 25 data products organized into clear domains: asset and operations (electric asset, gas asset, work orders, outage and reliability, crew, fleet, vegetation and other asset domains); customer (customer 360, omni-channel contact, programs and plans, rates); shared services (supply chain, vendor, finance, property, employee); and ESG, markets and external intelligence. Alongside it sit the taxonomy of functional themes, the source-to-product mapping, a value-based prioritization that puts electric asset, electric flow, outage and reliability, and work orders first, and a sequenced foundations roadmap.
The result
The work enables a strategic shift: away from bespoke, point-to-point integrations and toward one-stop-shop data products that are built once, governed and reused across every team.
- One shared blueprint. A MECE catalog the whole enterprise can align to, instead of competing, overlapping definitions.
- A clear build order. Products sequenced by reuse and impact, so foundation work starts where it pays off fastest.
- A reusable foundation. New AI and analytics use cases start from curated, governed data products rather than raw systems, cutting the data-wrangling tax on every future initiative.
- Business-validated, not top-down. The catalog was shaped with the people who own the data, so it reflects real needs.
This is foundational strategy work, developed iteratively. Most business-unit sessions are complete, with validation and sequencing continuing, and the catalog and roadmap are living artifacts rather than a finished system. It is the groundwork that makes platform builds faster and more coherent, such as a unified asset-health data foundation.
By the numbers
- 25 data products defined
- More than 500 data components cataloged and grouped into about 40 functional themes
- Roughly 1,200 applications narrowed to about 40 priority source systems
- 11 business-unit working sessions